One of the key challenges in building an AI analytics platform is creating a unified and coherent knowledge hub that abstracts from the organization’s data, a.k.a., a semantic layer that bridges the gap between actionable insights and raw data (see our previous blog “4 Key Challenges: Establishing a Semantic Layer for Your Enterprise”). In many enterprises, valuable data insights which take weeks to curate and validate are lost among countless dashboards and reports.
At Numbers Station, we’ve built a solution that can extract knowledge from an organization’s various data catalogs and unify them into a semantic catalog which powers our conversational analytics platform. As an example, we will dive into how we extract and integrate information from Tableau workbooks into Numbers Station.
.
What is a Tableau Workbook (TWB)?
Tableau has become the cornerstone for data visualization and business intelligence. One of its core components is the Tableau Workbook (TWB).
A Tableau Workbook holds a collection of worksheets. Each worksheet will contain user-defined metrics and dimensions about the data that are used to generate dashboards. A TWB is an .xml file that contains the data sources and worksheets created in Tableau, containing important business metrics and definitions of which Numbers Station can parse through.
Why would we integrate Tableau workbooks into Numbers Station?
We view Tableau workbooks as a valuable source of enterprise knowledge regarding their business and data. In particular, we are interested in the information of the data sources defined in the TWB (e.g. What are the table and column names? How do the tables relate to each other?) and what dimensions and metrics are defined and used in the worksheets. For that, we create a Numbers Station parser agent that processes the TWB file and extracts the information.
.
How do we integrate Tableau workbooks into Numbers Station?
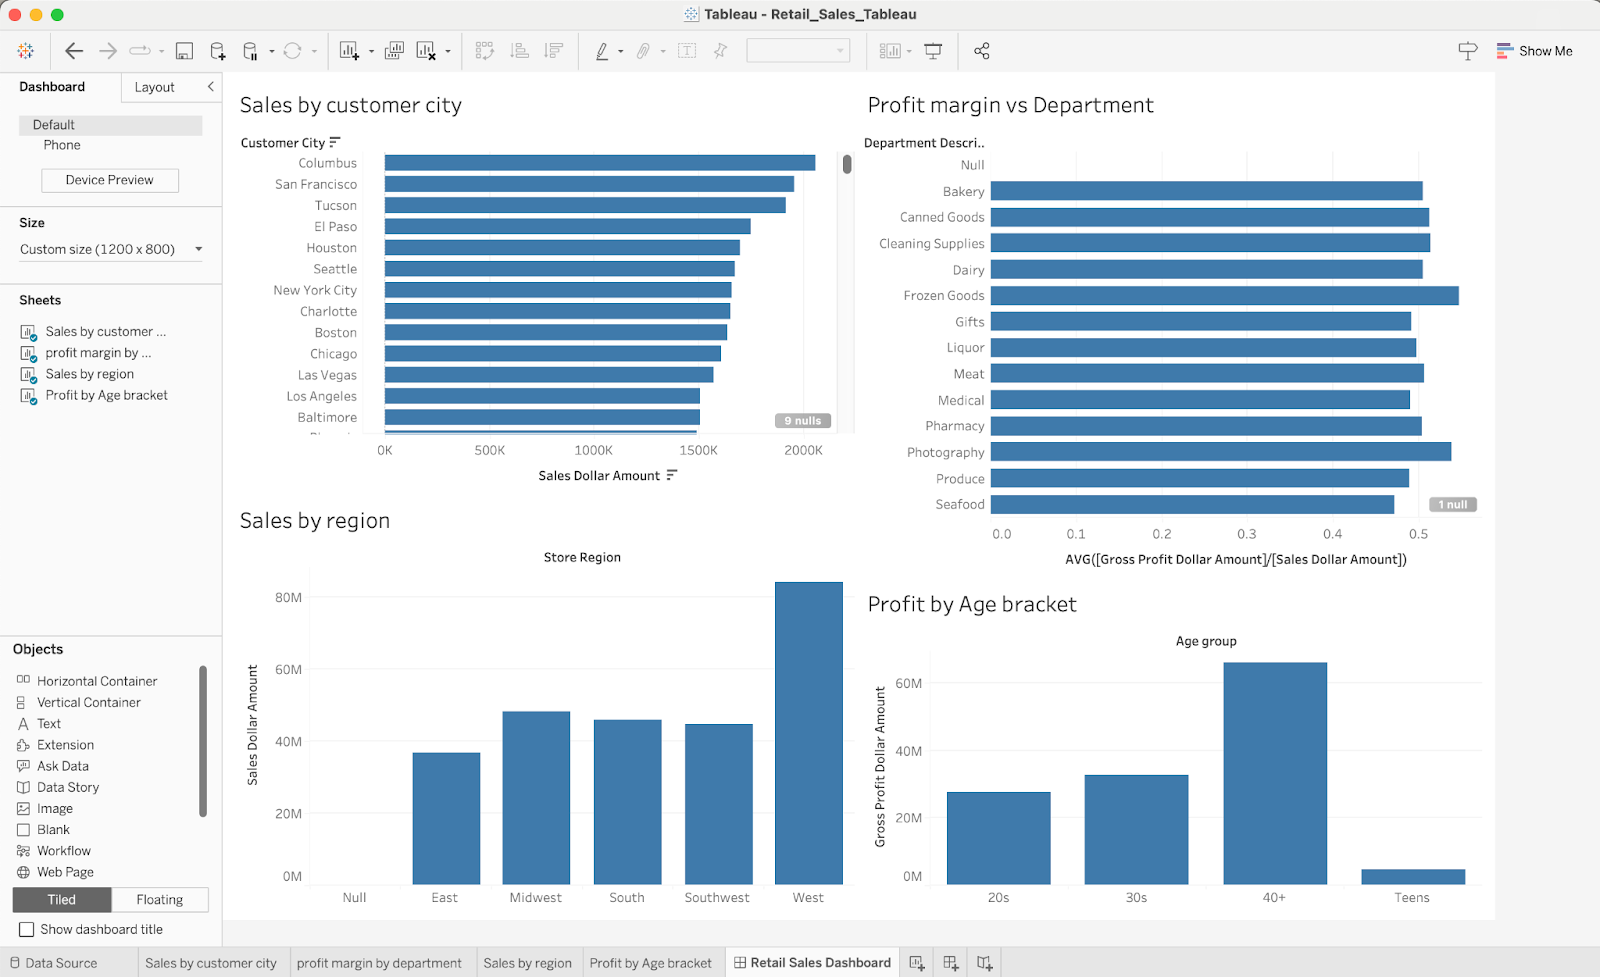
Here we have a TWB on retail sales data. In this example, the data source consists of tables from a Snowflake data warehouse. The workbook contains one dashboard and 4 worksheets within it.
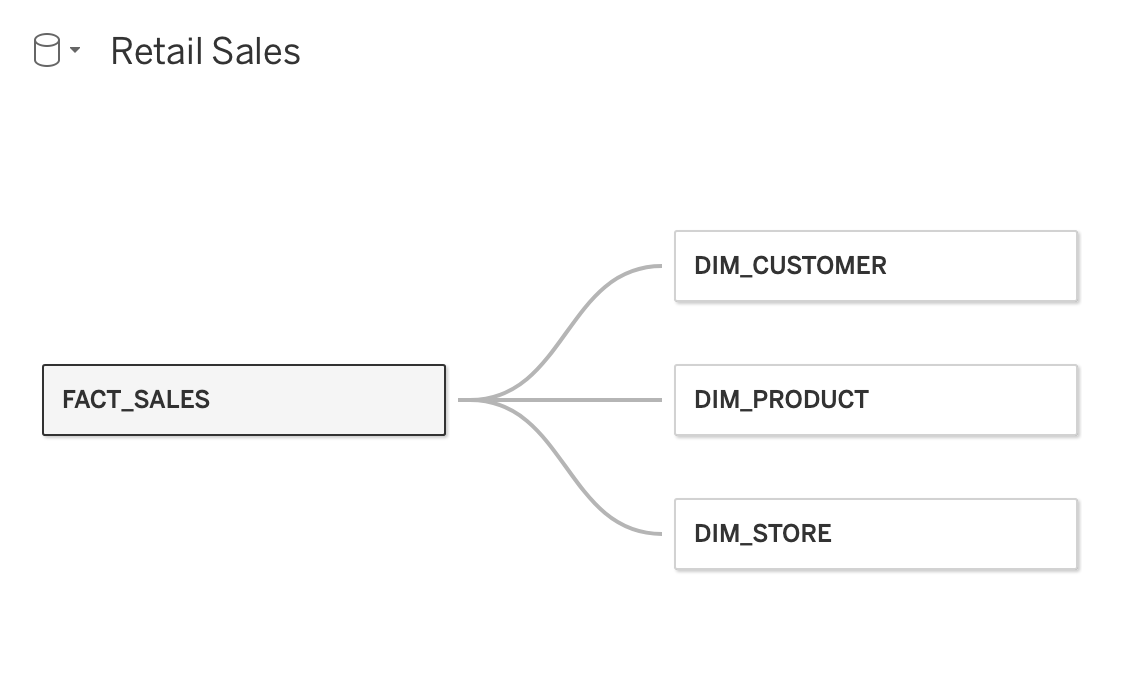
After we upload the TWB file into Numbers Station, the first step is to extract the data source’s information to uncover what database we connect to and what the underlying data model is. In this case, it is a star schema consisting of 4 tables from a Snowflake data warehouse.
With proper access authentication, we further extract the defined dimensions and measures from the worksheet and convert them into our own unified knowledge layer (a.k.a. the semantic layer). Within a few minutes, our system will create a “Retail Sales” dataset. At this point, you can “talk” to your dataset to extract actionable insights.
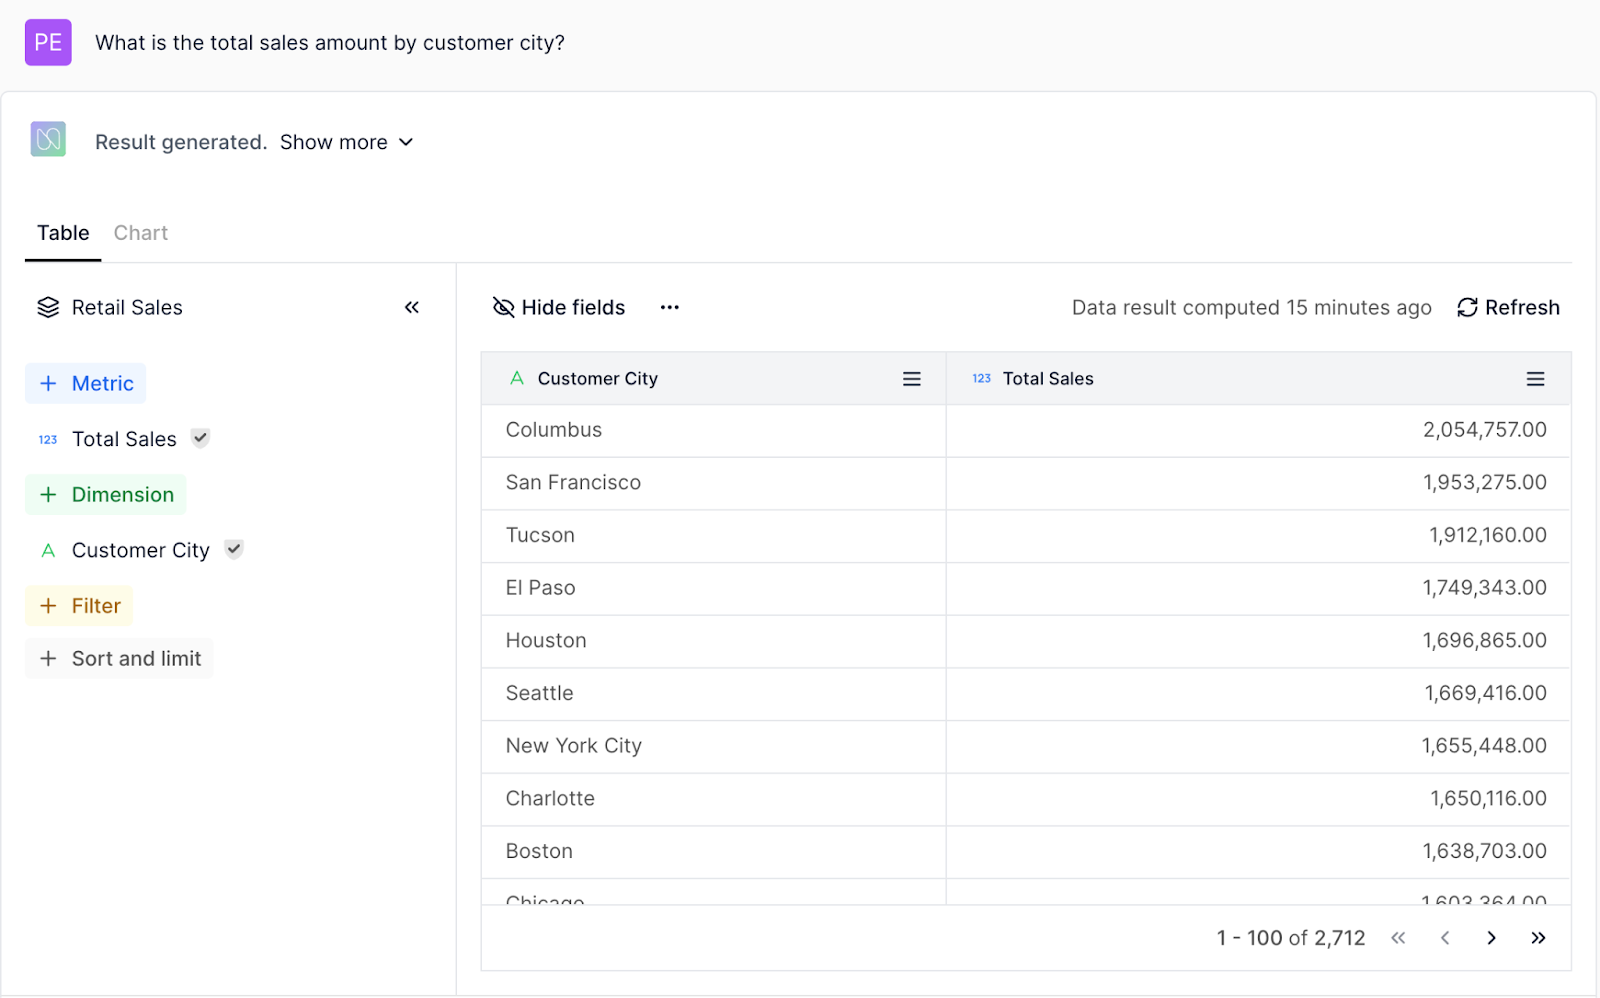
Immediately you can ask the following 4 questions that are related to the original dashboard. (You can switch between Table or Chart mode in our platform in terms of displaying the result)
- What is the total sales amount by customer city?
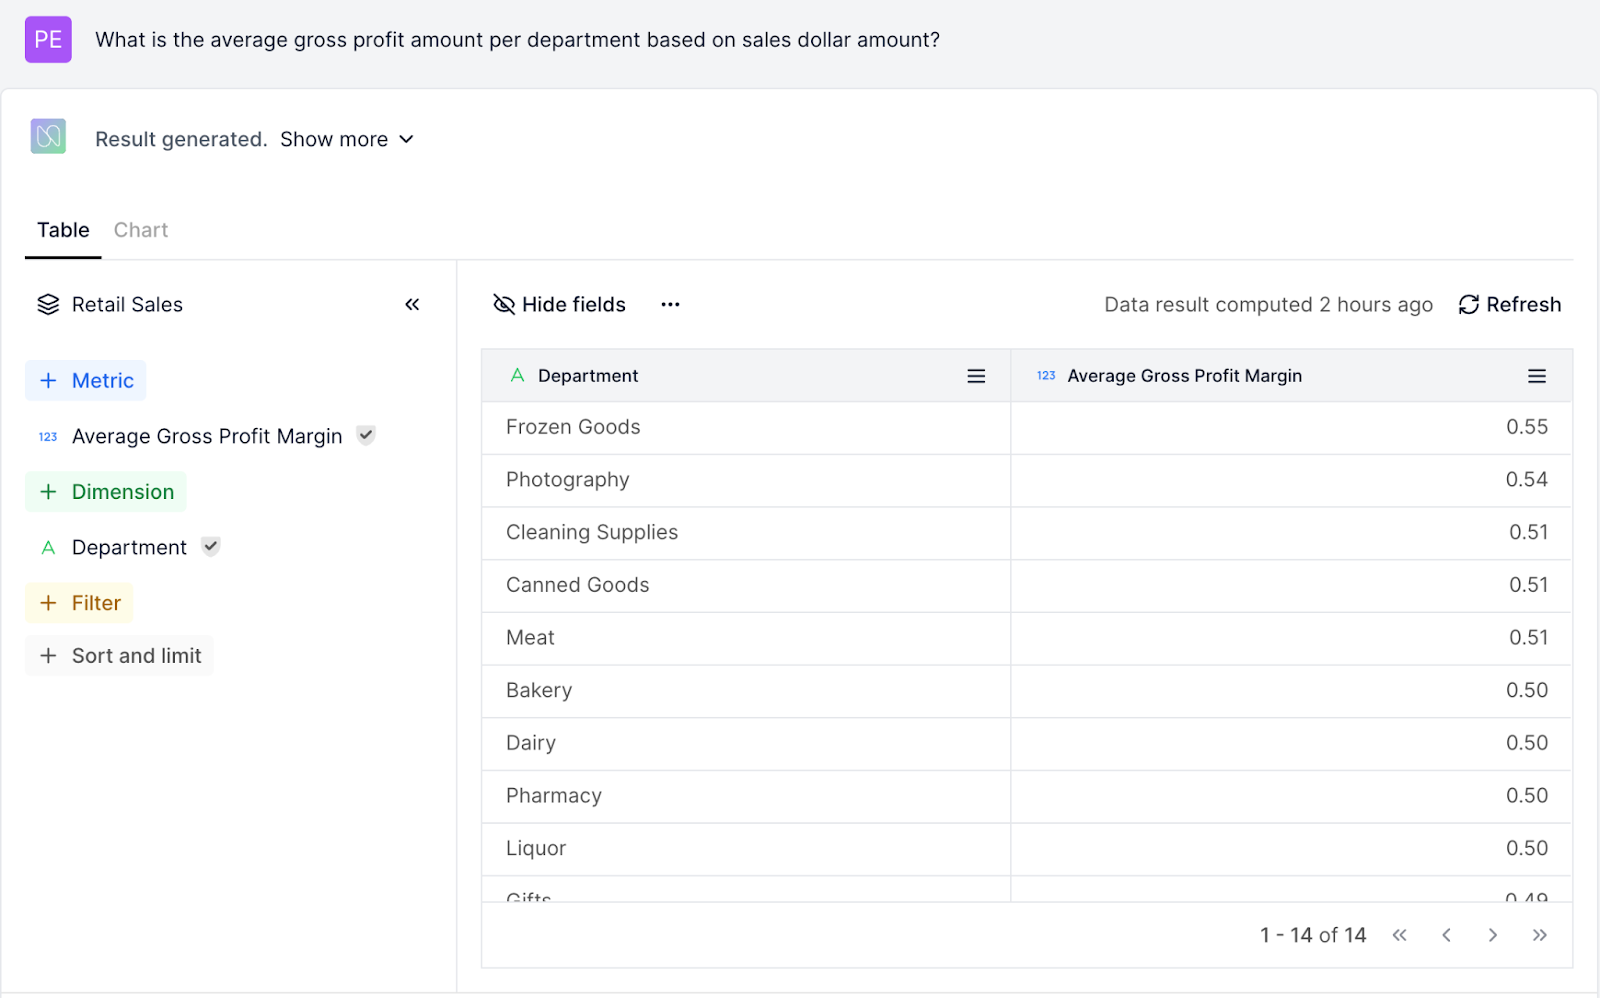
- What is the average gross profit amount per department based on sales dollar amount?
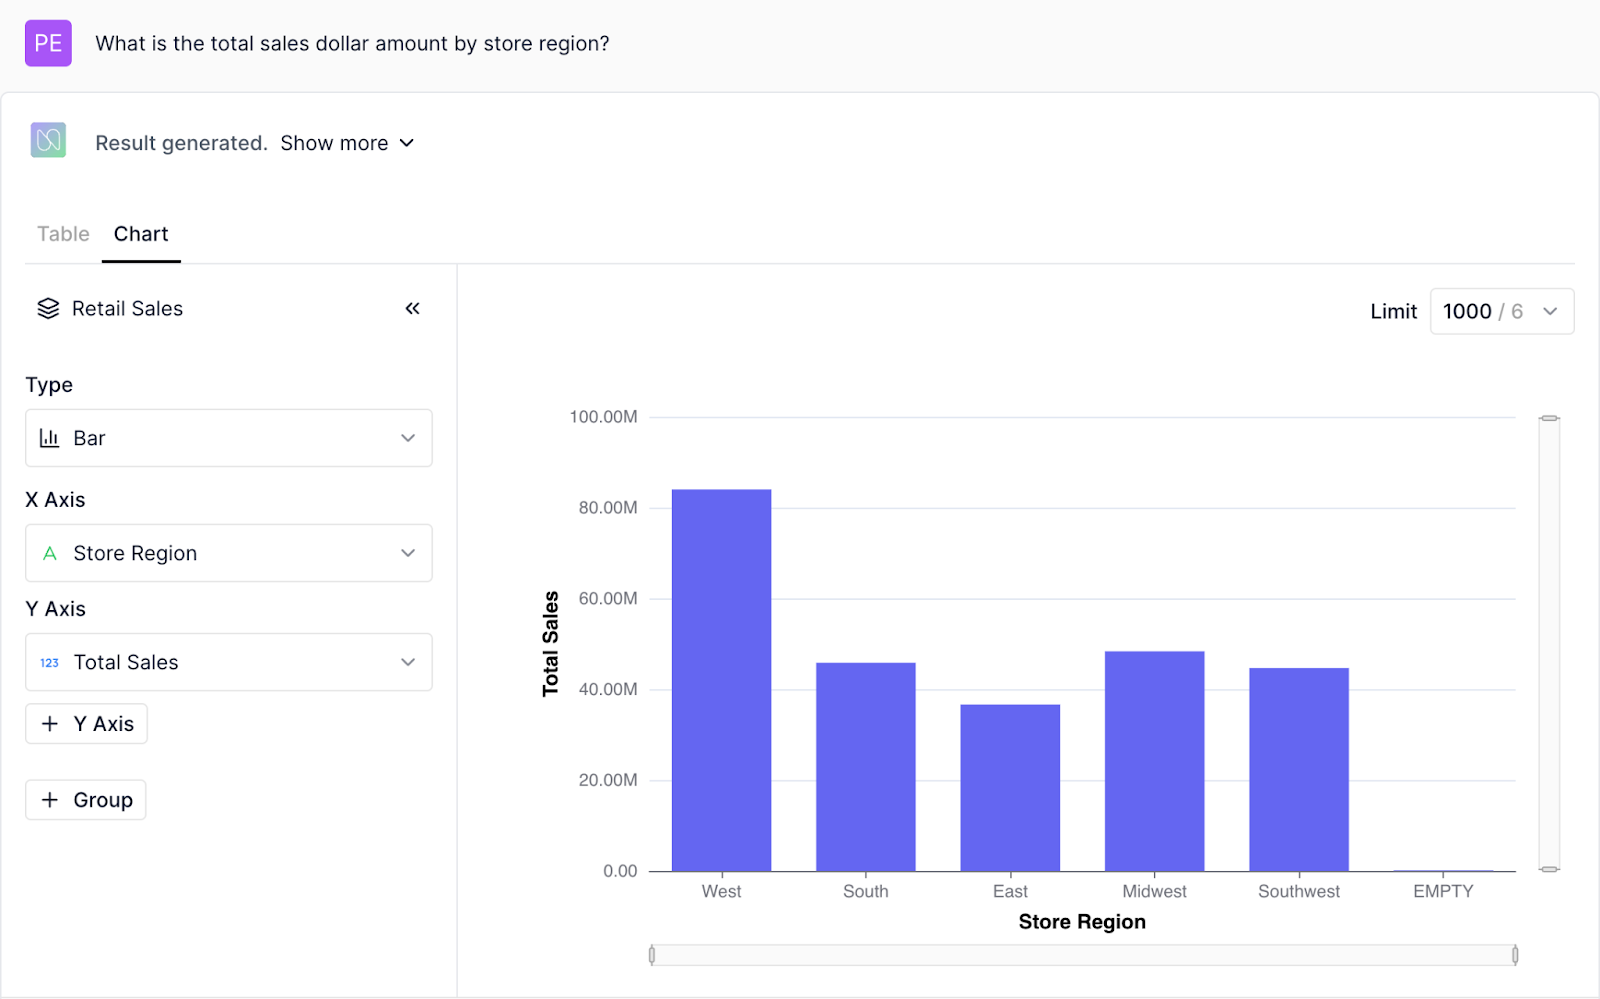
- What is the total sales dollar amount by store region?
- What is the sum of gross profit for customers categorized by age group?
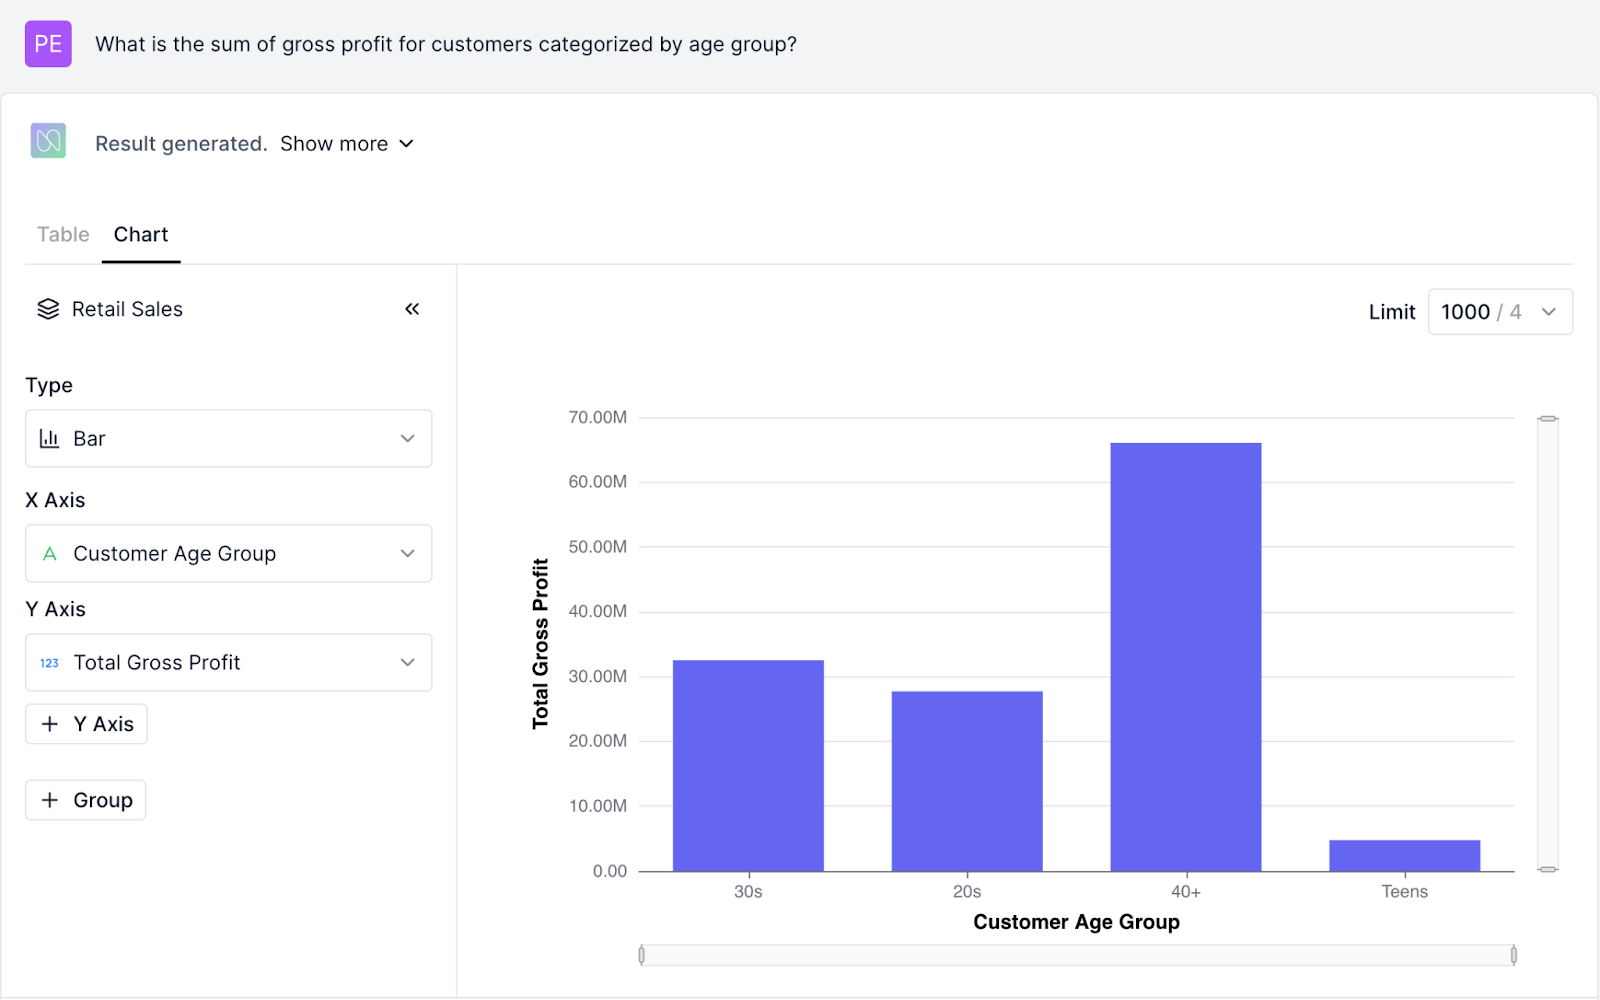
Just via simply asking the question in natural language, the user is able to obtain the information illustrated from the tableau dashboard. The core idea here is to extract and unify useful information into the semantic layer, which will guide our AI analytics agent to generate accurate and reliable answers. For example, in the “Profit by age bracket” worksheet, the “age group” dimension should be defined as IF [Customer Age] < 20 THEN ‘Teens’ ELSEIF [Customer Age] < 30 THEN ’20s’ ELSEIF [Customer Age] < 40 THEN ’30s’ ELSE ’40+’ END. Without this prior knowledge, no human or AI entity can instinctively define the breakout of “age bracket” as it differs across enterprises. As one can imagine, in different organizations, there can be more complex business logic embedded inside various dashboards than this simple “age group” dimension. The unified semantic layer, once injected with that knowledge, is the key to accuracy and robustness of our AI analytics platform.
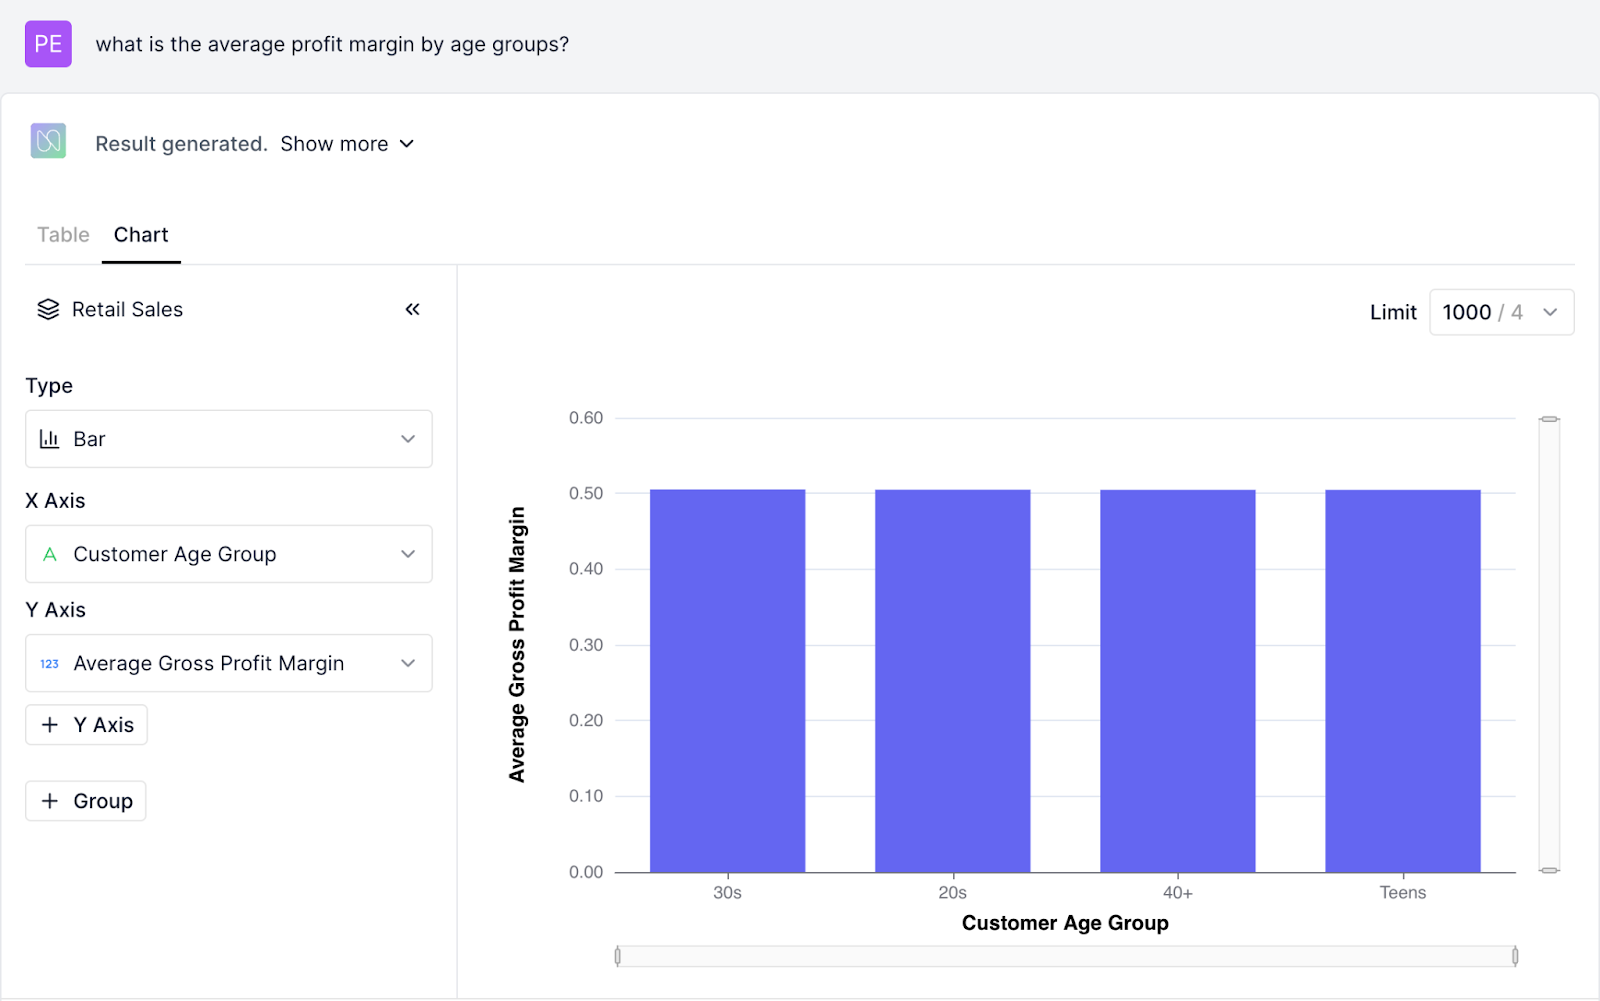
Furthermore, extracting and unifying business knowledge is not just to replicate the existing dashboard, but to go beyond visualizations and gain data-driven insights by simply asking natural language questions. For example, you can ask a question like “what is the average profit margin by age groups?”[Figure 3]. The answer to this question was never explicitly built in the original dashboard, but our system is able to figure out the answer query by reusing the dimension “Customer Age Group” extracted from the worksheet “Profit by age bracket” and the metric “Average Gross Profit Margin” from another worksheet “Profit margin by department”.
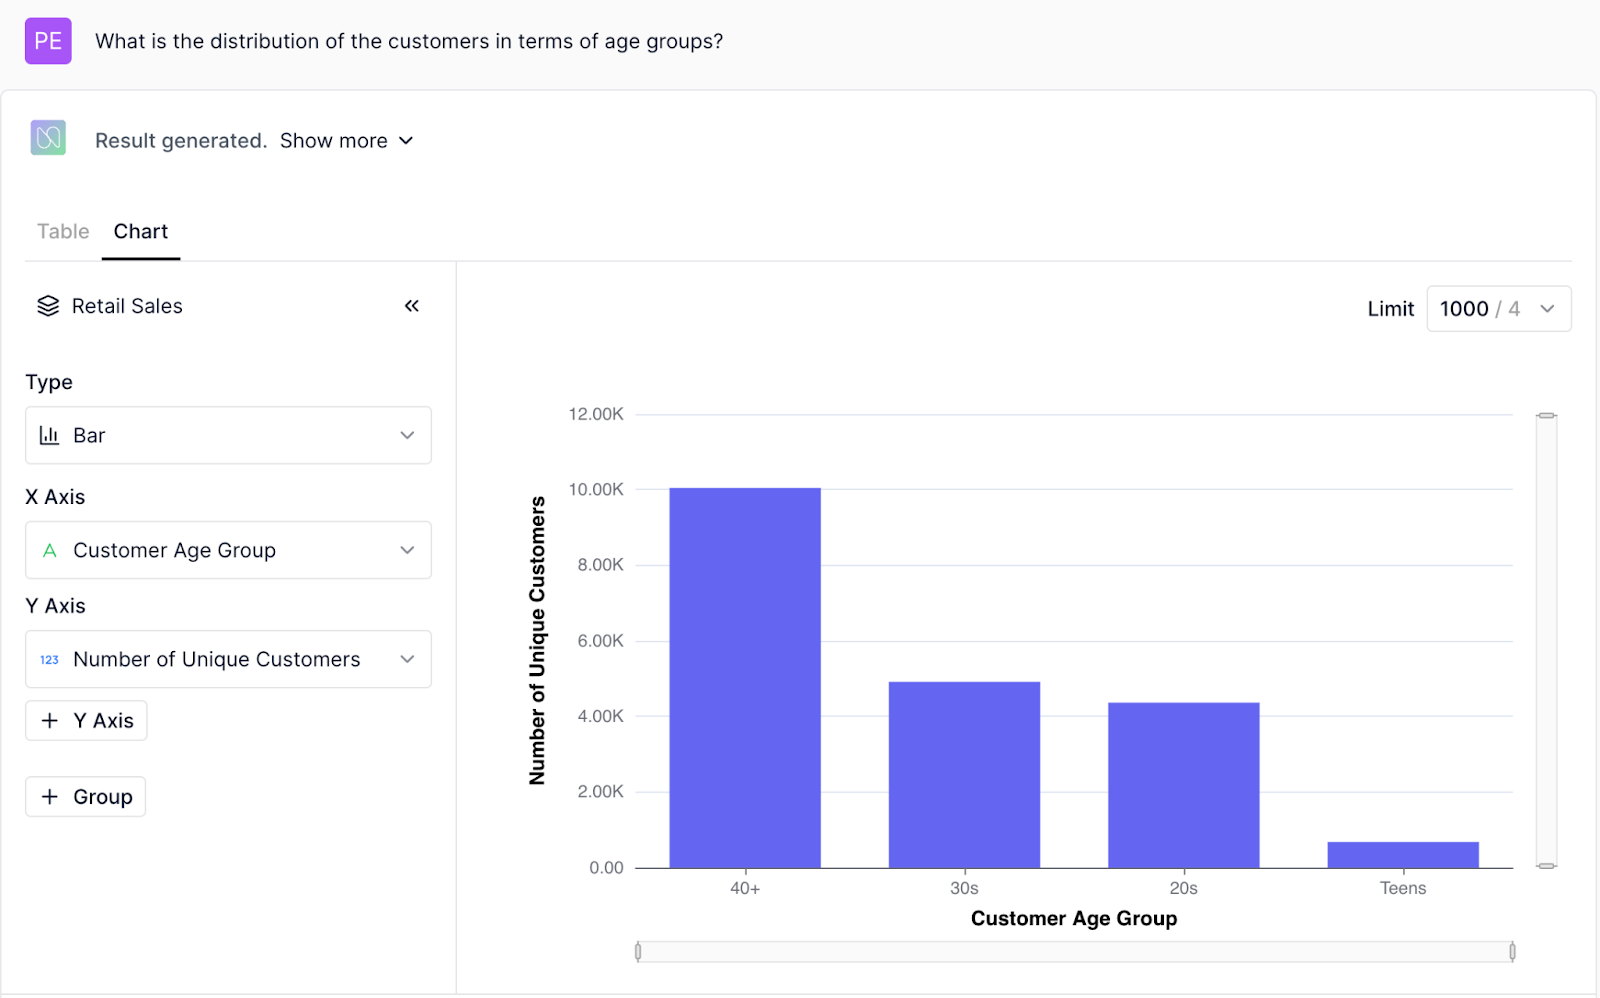
As another example, you can ask the question “What is the distribution of the customers in terms of age groups?”[Figure 4]. In this case, our platform will create a new metric “Number of Unique Customers” along with the existing dimension “Customer Age Group” to answer this question.
Extending questions beyond the static manually-curated dashboards is really a key advantage of our conversational analytic platform. And this extensibility and flexibility is impossible without the unified semantic catalog.
.
Conclusion
Integrating Tableau workbooks is a great example of how Numbers Station extracts and unifies valuable enterprise knowledge into a cohesive semantic layer. This integration is vital for transforming fragmented data insights into actionable intelligence, ensuring that crucial information is not lost in countless dashboards and reports. With Numbers Station, users can easily speak to their data using natural language questions and obtain deep insights that were not explicitly built in the original reports. Ultimately, the seamless integration of Tableau workbooks into Numbers Station exemplifies our commitment to delivering advanced, user-friendly analytics solutions that bridge the gap between raw data and actionable insights, empowering organizations to make smarter, data-driven decisions.
If you are interested in integrating your warehouse into Numbers Station, contact us today!